Quick & easy live spectrograph for your audio files
 Maztr's free online
Audio Spectrograph is a quick and easy tool you can use right in your browser, without downloading any software, to view live frequency and
amplitude data from your audio files. No account or login is required to use it.
Maztr's free online
Audio Spectrograph is a quick and easy tool you can use right in your browser, without downloading any software, to view live frequency and
amplitude data from your audio files. No account or login is required to use it.
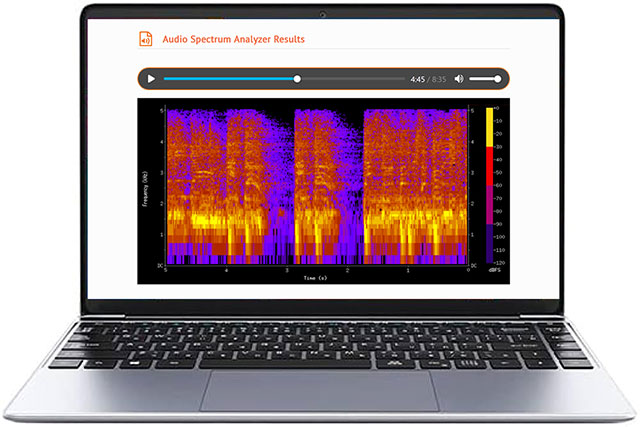
A Spectrograph shows you a visual illustration of your audio files and helps you identify the frequencies they contain - a "picture of sound". This image is also known as a Spectrogram and allows you to "see" your audio files. Click here if you want to print a full Spectogram of your audio files.
We have many more free tools for your audio files. Click here to check them out.
A Spectrograph is a device or software used to measure and record the intensity of sound at different frequencies. It produces a Spectrogram, which is a visual representation of the spectrum of frequencies of an audio signal over time.
A Spectrogram shows time on the horizontal x-axis and frequency on the vertical y-axis. Lower frequencies are shown towards the bottom of the Spectrogram and higher frequencies towards the top and these vary over time across the horizontal axis.
In addition, a Spectrogram also shows amplitude (loudness) through differences in color or darkness. Lighter areas are frequencies with higher amplitude (louder) while darker areas are quieter with lower amplitudes.
A Logarithmic Scale transforms sound frequencies for better human perception. Unlike a Linear Scale, it compresses higher frequencies and expands lower ones, providing a balanced representation of the entire range. This feature helps users gain a better understanding of the signals contained in an audio file.
Click here to try our Audio Spectrum Analyzer. This is a more advanced Spectrograph that gives you more control over audio inputs and outputs. You'll also find more information about Spectrographs and Spectrograms on this page.