Quick & easy frequency spectrum viewer for your audio files
Maztr's free online Audio Frequency Viewer is a quick and easy tool you can use right in your browser, without downloading any software, to view the spectrum of sound frequencies in your audio files. No account or login is required to use it.
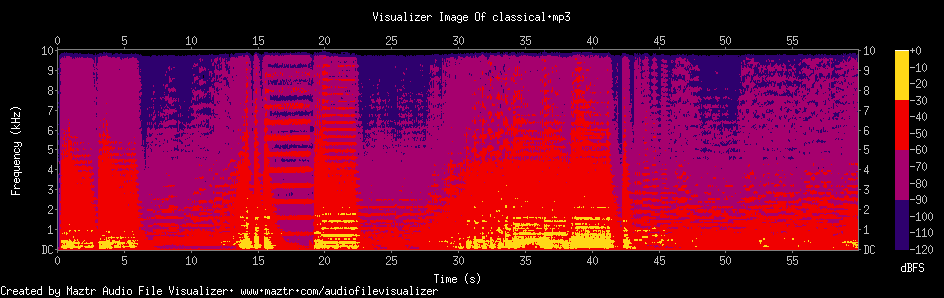 Our Audio Frequency Viewer can
show you a visual illustration of your audio files and help you identify the frequencies they contain - a "visual sound image". This image is also known as a
Spectrogram and allows you to "see" your audio files. It's similar to the idea of a music score, except it records sound frequencies instead of musical notes.
Our Audio Frequency Viewer can
show you a visual illustration of your audio files and help you identify the frequencies they contain - a "visual sound image". This image is also known as a
Spectrogram and allows you to "see" your audio files. It's similar to the idea of a music score, except it records sound frequencies instead of musical notes.
Want to see the sound frequency spectrum from your audio files in real time? Click here to use our free Audio Spectrum Analyzer. If you want a detailed analysis of your audio files, click here to use our free Audio File Analyzer. We have many more free tools for your audio files. Click here to check them out.
A Spectrogram is a visual representation or image of the spectrum of sound frequencies in a sound file. Maztr's Audio Frequency Viewer can produce a Spectrogram — a visual sound image — of your audio files.
A Waveform only shows changes in a sound's amplitude over time — the classic up and down wavy sound line. In contrast, a Spectrogram shows changes in sound frequencies over time, with amplitude overlaid through varying colors on an image. As a result, a Spectrogram provides much more information and allows you to see details that can't be seen in a Waveform. Problems in a sound mix can be identified and fixed more easily.
A Spectrograph is a device or software that creates a Spectrogram. Maztr's Audio Frequency Viewer is therefore a Spectrograph.
Yes, the following limits apply based on your Maztr Subscription: