Quick & easy waveform viewer for your audio files
 Maztr's free online Audio Waveform Viewer is a quick and easy tool you can use right in your browser, without downloading any software, to help you
see the shape and flow of your audio files over time, plotted on a graph. No account or login is required to use it.
Maztr's free online Audio Waveform Viewer is a quick and easy tool you can use right in your browser, without downloading any software, to help you
see the shape and flow of your audio files over time, plotted on a graph. No account or login is required to use it.
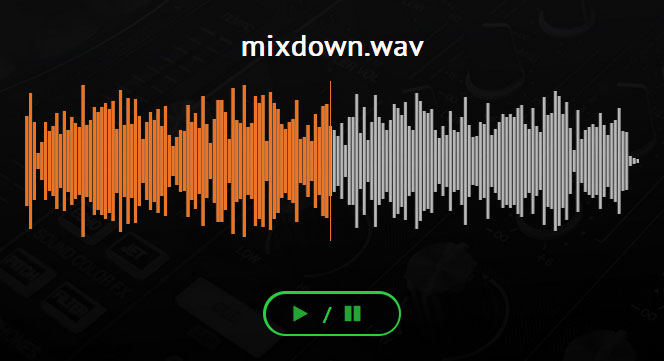
A waveform shows changes in a sound's amplitude over time — the classic up and down wavy sound line. Using this tool, you can play a track and see how the sounds affect the waveform it produces. By studying the waveform, you can learn more about the sound. Please note that large files can take a little time to process.
Want even more detailed images of your audio files? Click here to use our free Audio File Visualizer, which can create a full spectrogram of your files. We have many more free tools for your audio files. Click here to check them out.
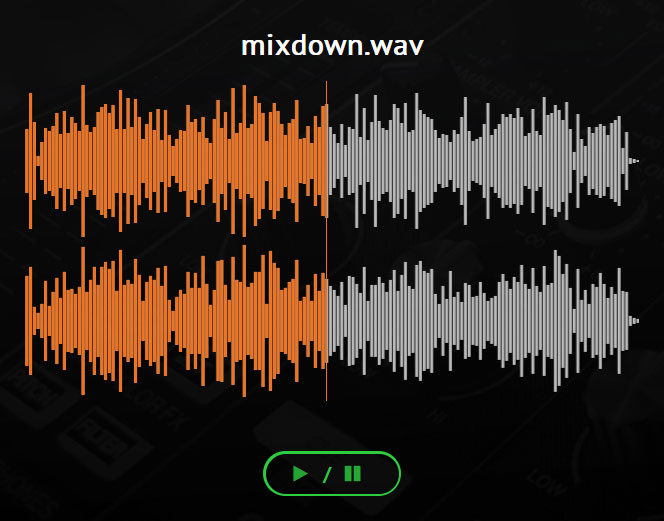 Can I see both channels of a stereo audio file?
Yes, you can select "stereo" in the Channel section above to split stereo tracks into Left and Right Channels. The image to the right shows how this affects the waveform output.
A waveform is basically a graph that plots a sound's amplitude over time. Amplitude can be thought of as the strength of sound vibrations in the air and is shown on the vertical axis of the graph. Time is shown on the horizontal axis and measures the speed of the sound vibrations. Amplitude changes polarity over time, which means positive and negative values appear above and below a baseline, like a sine wave.
You can learn more about your music by studying the patterns in the waveforms. The waveform shape gives you useful information about factors such as timbre, pitch and intensity.
If you need more information about Audio Waveform Analysis, click here to read our Blog article on the subject.
Yes, the following limits apply based on your Maztr Subscription: